
We have some good news for you, dear Twitter users! You can now shape up your Twitter marketing strategies with more precision than ever. With the help of a boon of tool called Twitter analytics you can keep track of how and where your marketing strategies are taking your business.
Now so that we have a better understanding as to how this tool works lets take a look at the below excerpt from Social Media Examiner.
Twitter Analytics
Core Twitter Analytics on the Home Tab
Ian explains that once your account is 14 days old, you can access the free analytics provided by Twitter by going to Analytics.Twitter.com on your desktop. You’ll start off with an overview on the Home tab, from which you can drill down to view data on tweets, audiences, video analytics, and more.
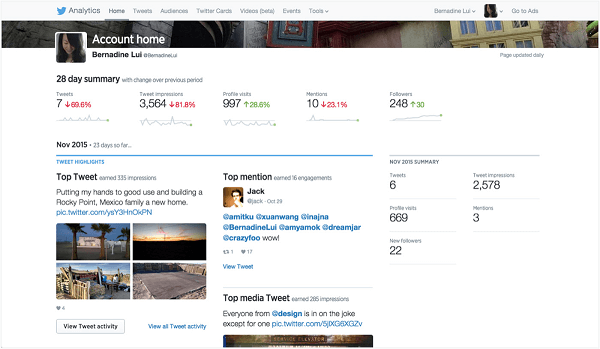
Log into Twitter Analytics to get an overview of your activity.
On the Overview screen, you’ll see the total number of impressions for all of your tweets. Impressions are the actual number of people who saw your tweets on their Twitter timeline, by visiting your profile, or in a search. For instance, they may have clicked on a hashtag and your tweet was listed.
Ian wonders whether Twitter is able to access all of the information for tweets displayed in third-party tools (Hootsuite, Sprout Social, etc.). He goes on to say that even though the data is never going to be 100% accurate, it will give you a gauge to see if your impressions are going up or down each month.
Profile Visits is the total number of people who visited your profile on mobile and desktop combined. This number is important, Ian explains, because when you pin a really good tweet to the top of your Twitter profile, you have an idea of how many people have seen it.
For example, if Ian’s profile shows 17,000 visits, that means 17,000 people have seen his pinned tweet, which is an opt-in to download a lead generation guide. He uses this tweet to build email subscribers from people visiting his Twitter profile. It’s a simple thing, but it’s the equivalent of having a big opt-in at the top of your website.

Use pinned tweets, as Ian does, to drive traffic to your website and increase opt-ins.
Mentions show how often your Twitter username is mentioned on other people’s profiles. For example, the number of people who shared your content and mentioned your Twitter name will show up there.
While they’re not clickable, the mountain graphs you see under each data label give you an idea of whether that data set is increasing or decreasing at a glance. For example, you can see if your impressions are going up or down over the course of the month. Or you can check the Followers graph to see if your audience is growing or diminishing.
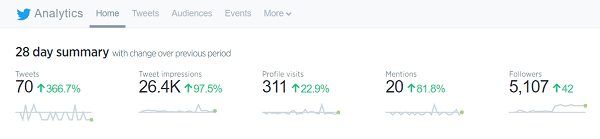
View graphs to see your Twitter activity at a glance.
The Top Tweet section of the Overview screen shows you your best tweet over the last 28 days and the number of impressions and retweets on it. Ian explains that you want to see what your most popular tweets are, so you can turn them into evergreen tweets to share regularly. There’s no point in retweeting content that’s not resonating with your audience.
The Top Mention section shows you when someone else shared a piece of your content and mentioned your name, and it did really well. The Top Follower is your follower who is followed by the most people. If someone with a large following has followed you, and he or she is relevant to your audience, pay attention to and start interacting with that person, Ian suggests.
Listen to the show to discover the difference between the top tweet and the top media tweet.
Other Twitter Analytics Tabs
The next tab is Tweets. At the top is a 28-day graph where you can see impressions and how many tweets you send on a daily basis. If you look at this graph, you’ll see which day of the week gets you the most impressions. You can also compare tweets week to week, and if your impressions and engagement go down, you can make changes. Then see if the analytics improve the following week.
In this tab, you can sort by top tweets and change the date range of your data.
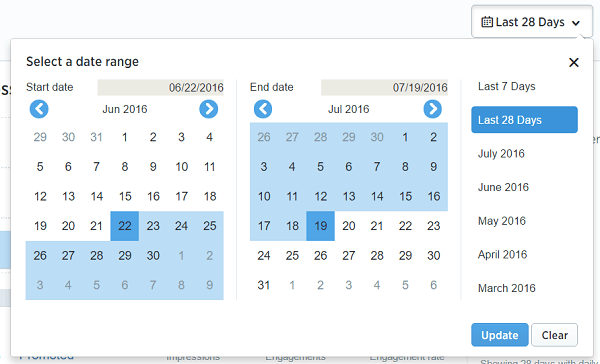
Change the date range of your Twitter activity for a larger or smaller range of activity.
The Engagements column shows the number of times somebody interacted with a tweet. You can view specific tweet activity (retweets, likes, link clicks, etc.).
Plus, if you actually find a particular tweet in the table as shown below, you’ll see its related impressions, engagement, and the engagement rate (the impressions divided by engagement).
When you click on that particular tweet, a summary of tweet activity will pop up. For example, you’ll be able to see that 12 total engagements include five retweets, five likes, one media engagement, and one detail expand.
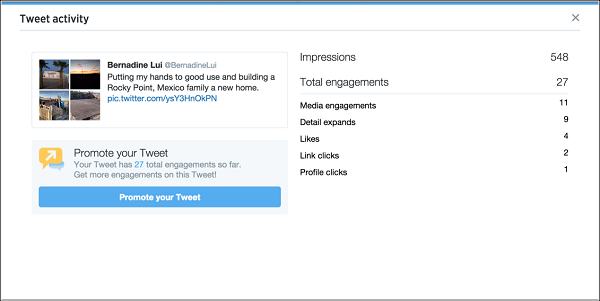
View a summary of each tweet’s activity to see the types of engagement.
From the Tweet Activity tab, you can also export the data to create your own graphs and charts of your Twitter activity.
The Audiences tab starts by showing a graph of your follower growth and the size of your audience. While you want to see your followers growing on steadily, Ian cautions that it’s more important that it’s a relevant following. One way to gauge the relevance of your following is to see how Twitter breaks down and analyzes the interests and the occupations of your audience.
For instance, when Ian looks at his followers’ Interests table, he sees they’re interested in marketing, technology, and entrepreneurship, which is the type of people he wants to attract.
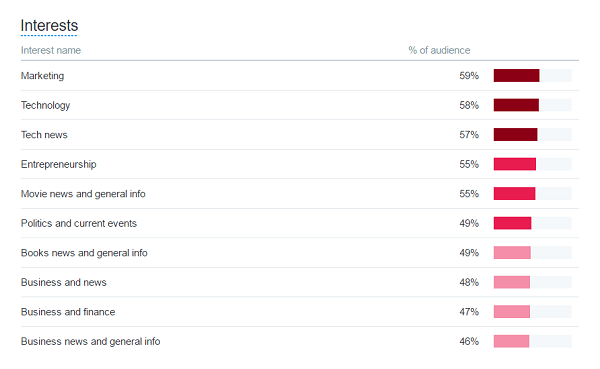
See if the interests of your followers align with the people you want to attract.
Within this tab, you also have the ability to compare the interests of your audience against other specific groups, and review U.S.-based household income.
Ian adds that using Twitter cards will help Twitter understand what a particular tweet is about, so when somebody shares something from your website, you’ll be able to see what types of Twitter cards are working on your website.
Finally, there’s the Events tab. Click on the View Details button to see how many tweets have mentioned the event, total reach, and impressions. You can even see the audience’s gender breakdown and which countries are generating the most tweets. Use the Create a Campaign button to target people interested in that event.
Listen to the show to learn what Ian thinks is missing from Twitter Analytics.
How to Go From a Tweet to a Sale
Ian says over the last couple of years, his company figured out the best way to move people from a social media channel to a sale; a model based on what he calls the PRISM framework.
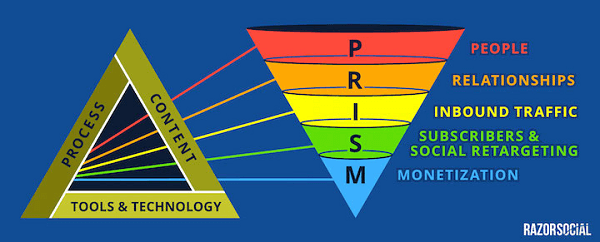
Ian’s PRISM system moves people from a tweet to a sale.
P is for People. As you build your following on Twitter, analyze it to make sure it’s the appropriate group of people.
R is for Relationships. You need to build relationships with the people who follow you. Build those relationships one-to-one on Twitter with influencers, or at scale to a wider audience by providing really good content that drives Inbound traffic.
Most people who’ve simply heard about you on Twitter won’t be ready to buy from you when they first click through to your site. It’s during this stage that you’ll need to capture their details to build a deeper relationship with them. Which brings up Subscribers and Social retargeting. Ideally, you can build your email subscribers from these visitors. If they don’t subscribe, you can retarget them with ads.