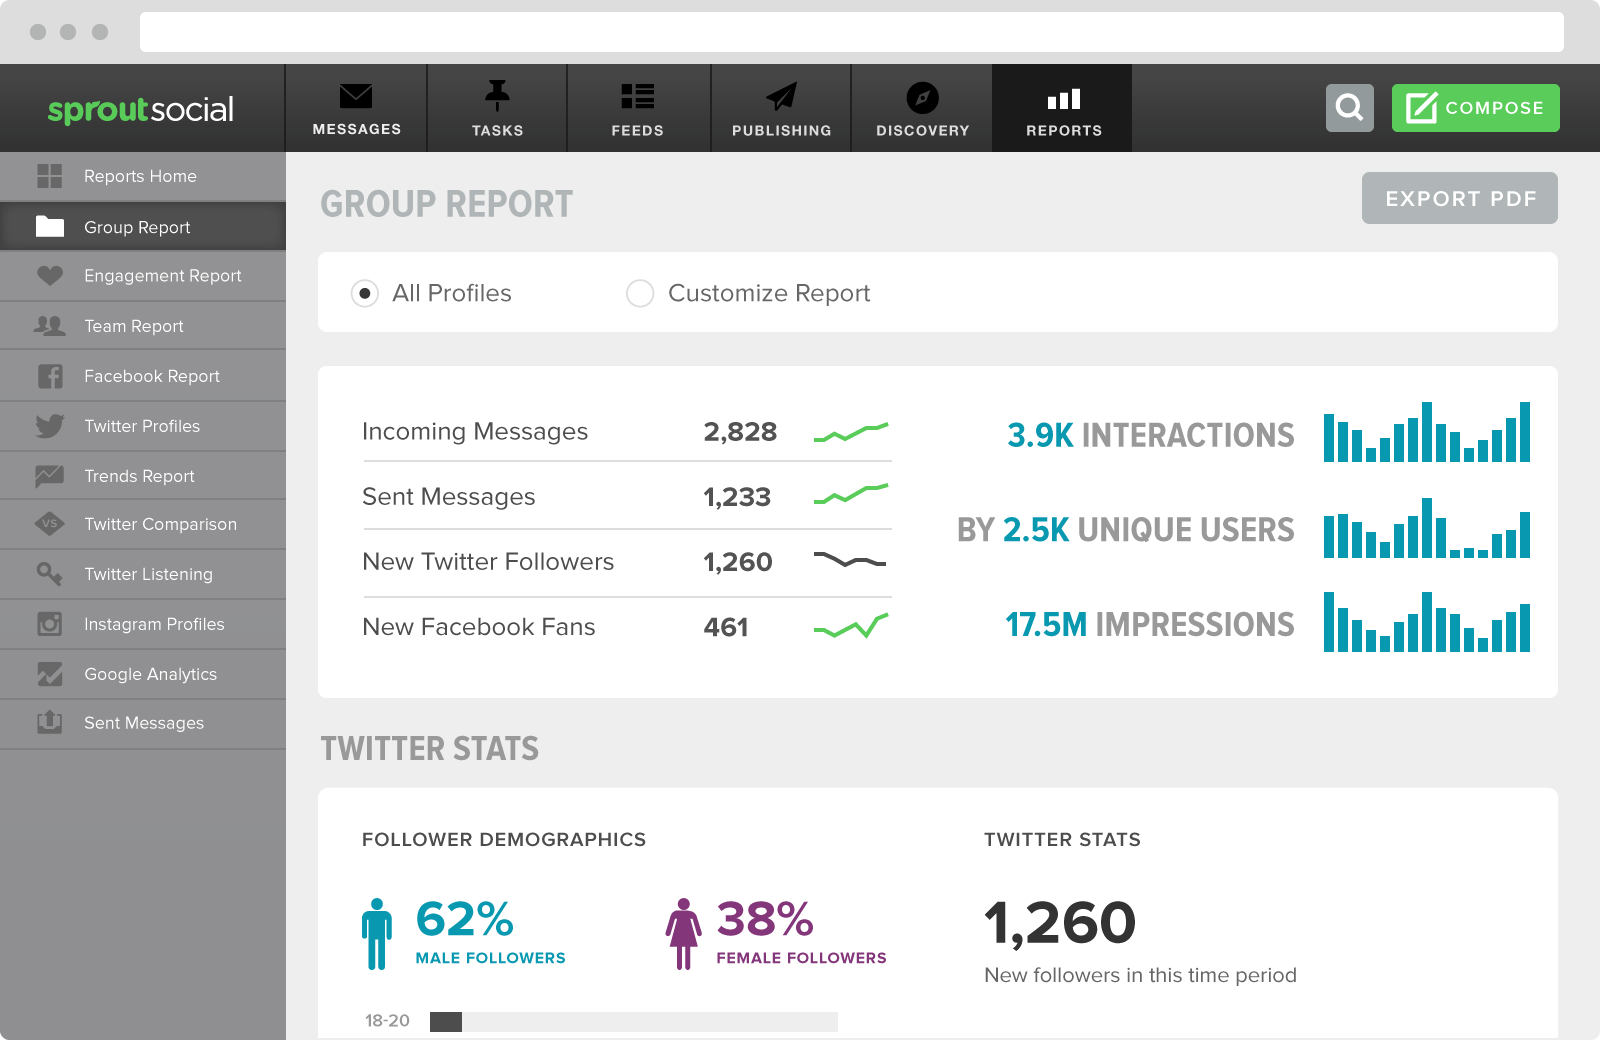
Whatever the field we choose to work in, we will be asked to show our work. In times like these we are at an advantage when we have a solid data base to show what we found where and what we based our findings on. Don’t you all agree?
You must be wondering why it is so important to show what work you have done. It comes handy when you need to prove to your investors that social media is a good bet when you want returns.
We have for you certain fool proof ways on how you can gather all your relevant social media data, as mentioned by Sprout Social.
What Is Social Media Data?
Social media data is the collected information from social networks that show how users share, view or engage with your content or profiles. These numbers, percentages and statistics provide better insights into your social media strategy.
Some of the raw social media data can include:
- Shares
- Likes
- Mentions
- Impressions
- Hashtag usage
- URL clicks
- Keyword analysis
- New followers
- Comments
While this list doesn’t include everything, it could tell you a lot about the effectiveness of your social media strategy.
How Does Social Media Data Work?
Once social media data is collected, it’s measured or analyzed to see what is and isn’t working. It’s best to think about social media data as the raw source you get when you mine or analyze your social networks. With the data, you can then build social media analytics to make sense of the raw information.
Think of social media data as the ingredients to your meal and the analysis as your recipe. Without the recipe, you wouldn’t know what to make or how to cook it. When you collect data, which most do, you’re able to make more wise and informed decisions.
Marketers and advertisers sometimes approach social media by throwing ideas against the wall–hoping something sticks. But collecting and measuring social data gives you insights to social shares and engagement.
Let’s get to the bread and butter of this article and learn how to successfully mine your social media data and measure your ROI:
Find Your Core Social Media KPIs
Key performance indicators (KPIs) are the various business metrics used to measure and analyze certain aspects of your business. Social media KPIs are the metrics that likely factor into your social media ROI.
You have to know what social media KPIs you need to track and analyze. Then you’ll gain a better idea of how your social strategy is performing. To go further, find your core KPIs to measure audience reach, customer engagement and response times.
Track the Unique Metrics from Each Platform
No matter the platform, you want to have a solid understanding to how well each network performs. Popular social networks understand the importance of analytics. This is we see more networks offering tools in the native platform.
Let’s take a look at the most popular native tools:
Facebook Insights
For those who own a Facebook business page, you can analyze some KPIs within the social network. The most essential Facebook metrics include:
- Engagement: This metric shows you the the number of post clicks, Likes, comments and shares within the last seven days. Additionally, the data is compared to the previous week.
- Impressions: The amount of times your Facebook Page is displayed, including those who click and do not click your content or Page.
- Organic Likes: The amount of people who Like your Page without coming from an ad campaign.
- Page Likes: This metric shows the total amount of Page Likes and new Page Likes with weekly data comparisons as well.
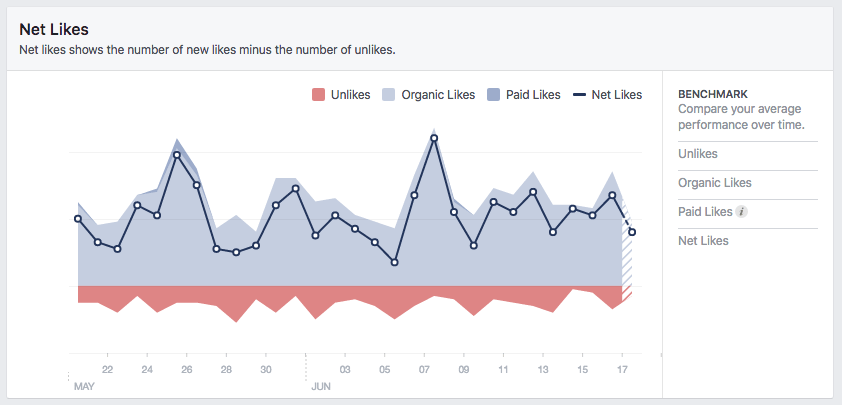
- Paid Likes: The amount of people who Like your page directly from a paid ad campaign.
- Post Reach: This metric shows your total reach, which is the amount of people who have seen any content or ads associated with your Page. There’s also Page Reach, which is the amount of views (impressions) for your Page posts.
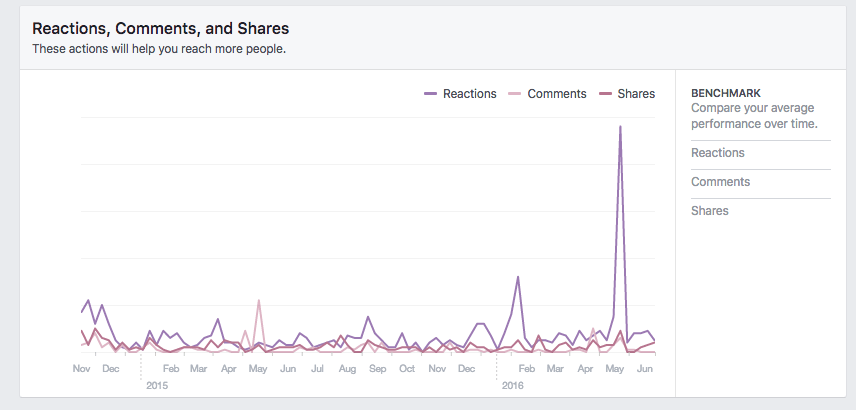
- Reactions: This metric shows the different reactions users posted to your post, including (Like, Love, Haha, Wow, Sad and Angry).
- Unlikes: The amount of people who unliked your Facebook Page.
Twitter Analytics
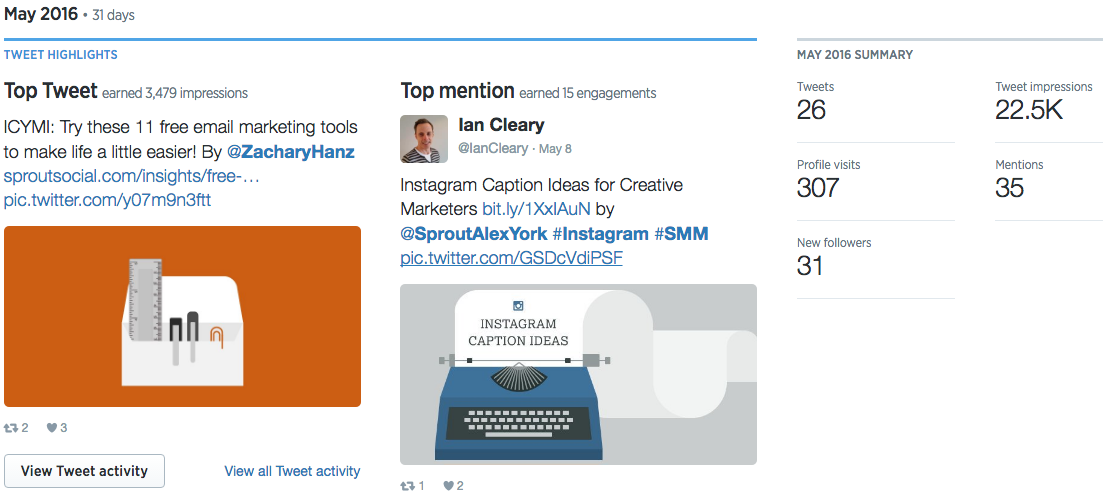
Whether you use Twitter for business or personal use, you have access to their analytics. The dashboard gives you a 28-day summary of your content and other key Twitter data. Here are some of the Twitter metrics to follow:
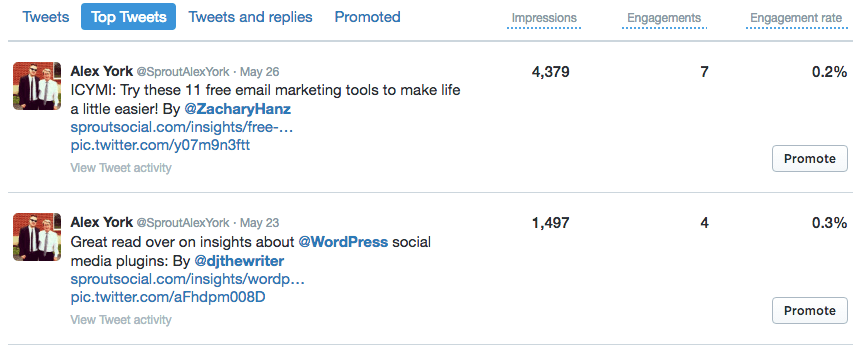
- Engagement Rate: Total link clicks, Retweets, favorites and replies on your Tweet divided by total impressions.
- Followers: Total number of Twitter followers.
- Link Clicks: Total number of URL and hashtag links clicked.
- Mentions: How many times your @username was mentioned by others.
- Profile Visits: Total Twitter profile visits.
- Replies: How many times people replied to your Tweets.
- Retweets: Total Retweets received by others.
- Tweet Impressions: Total of times your Tweet has been viewed whether it was clicked or not.
- Tweets: How many Tweets you’ve posted.
LinkedIn Analytics
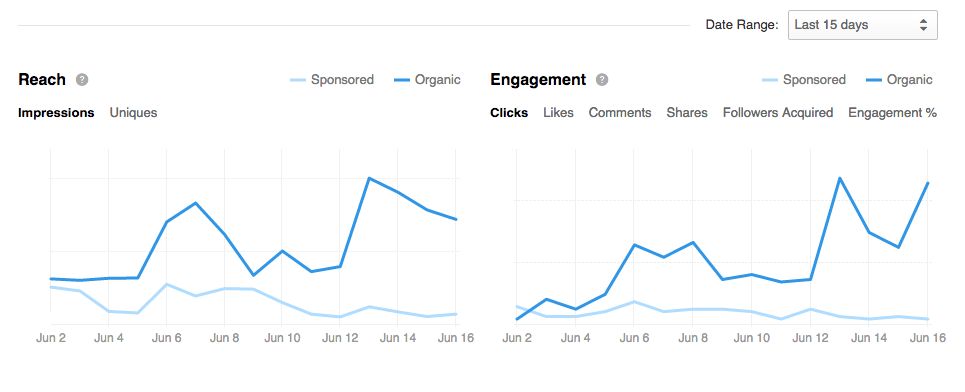
Another popular social media platform with built-in analytics tools is LinkedIn. You can access LinkedIn Analytics through your Company Page. This shows you all the social media data going into your LinkedIn Page. Here are the top LinkedIn metrics:
- Clicks: Total clicks on a post, company name or logo.
- Engagement: Total interactions divided by number of impressions.
- Followers: Total number of new followers through a sponsored update.
- Impressions: Total times your update was visible to other users.
- Interactions: Total number of comments, likes, comments and shares.
Google Analytics
While the other platforms provide helpful insights, Google Analytics steps up your data game. Here you learn about product sales, leads, guide downloads, duration times and much more. When it come to social media data here are a few metrics to note in Google Analytics:
- Average Session Duration: Average session times users spend on your site.
- Bounce Rate: Percentage of users leaving your site after one page view.
- New Users: Total number of new users coming to your site for the first time.
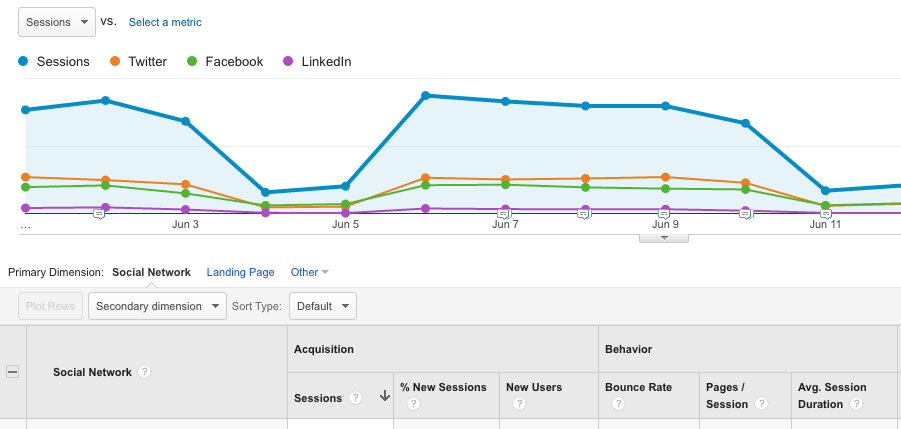
- Pages / Session: Average number of pages a user views each session.
- Pageviews: Number of pages loaded or reloaded in a browser.
- Sessions: Total times when users are active on your site.
Define Your Least & Most Important Metrics
Now that you have your social media data, you need to decipher what’s most important. There are several different routes you can take with this, but it’s smart to know your end goal.
If you wanted to track audience growth on Facebook, consider engagement rates, new followers, Post reach and organic Likes.
For example, if you launched a social media campaign, track data that highlights your ROI. According to Mashable, your ROI cycle for a social media campaign should be set up in three stages:
- Launch
- Management
- Optimization

